


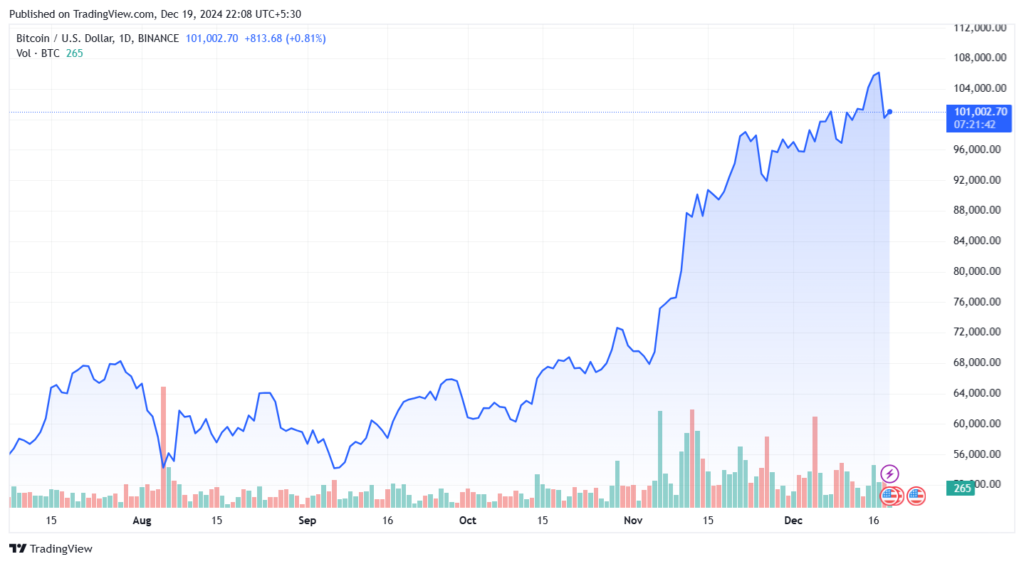
Bitcoin’s recent price action has triggered market-wide concerns as it briefly dropped below the key $100,000 mark, hitting a low of $99,047 on December 19, 2024. This sudden decline has investors questioning whether a Bitcoin crash is imminent. Despite a quick recovery, technical indicators point toward a developing bearish pattern, raising red flags about potential further declines.
Why Did Bitcoin Drop? Key Market Drivers
The recent price decline came after the U.S. Federal Reserve announced a modest 25-basis-point rate cut. While this move generally supports asset prices, the central bank hinted at fewer rate cuts in 2025 than previously anticipated. This hawkish tone dampened investor enthusiasm, causing a wave of selling pressure across financial markets, including cryptocurrencies.
Economic policies and interest rate expectations directly influence Bitcoin market sentiment. In this case, the lack of aggressive monetary easing caused investors to reduce their exposure to high-risk assets like Bitcoin.
Bearish Pattern in the Bitcoin Price Chart
Technical analysts have identified a potential bearish engulfing candlestick pattern forming on Bitcoin’s weekly chart. This pattern is often considered a major reversal signal, indicating that sellers are gaining control.
- Advertisement -

Key Technical Indicators to Watch:
- Support Level: $98,000 – A breakdown below this level could trigger additional sell-offs.
- Resistance Level: $105,000 – If Bitcoin breaks above this level, the bearish trend could be invalidated.
- Moving Averages: The 50-day moving average is trending downward, reinforcing bearish pressure.
- Relative Strength Index (RSI): RSI is nearing the oversold zone, currently hovering around 38, which suggests potential selling exhaustion but hasn’t confirmed a reversal yet.
What’s Next for Bitcoin?
The future of Bitcoin remains uncertain amid fluctuating market conditions and evolving macroeconomic factors. With its recent drop to $99,047 and a current price hovering near $100,000, investors are anxious about whether Bitcoin will recover or experience further declines. Here’s a detailed analysis of what could be next for Bitcoin based on key technical, market, and economic indicators.
- Sponsored -

1. Short-Term Outlook: Bearish Risks Remain
The short-term Bitcoin price prediction leans bearish due to concerning signals from its price chart and technical indicators. A developing bearish engulfing candlestick pattern on Bitcoin’s weekly chart could confirm further downside if Bitcoin closes below $98,000.
Key Levels to Watch:
- Support: $98,000 (critical support level); a breakdown could push prices toward $95,000 or even $90,000.
- Resistance: $105,000 (short-term resistance); a break above this level could invalidate the bearish trend.
Potential Scenarios:
- Bearish Continuation: If selling pressure intensifies and Bitcoin fails to hold $98,000, the next significant support lies at $95,000. A break below this point could trigger a sharp sell-off toward $90,000.
- Temporary Recovery: If Bitcoin stabilizes above $100,000 and manages to reclaim $105,000, it could spark a short-term relief rally toward $110,000.
2. Long-Term Market Sentiment: Will the Bulls Return?
Despite the current bearish trend, Bitcoin’s long-term potential remains promising. Historically, Bitcoin has recovered from similar downturns, often rallying to new all-time highs after experiencing a prolonged bear market.
Factors Supporting Long-Term Growth:
- Institutional Adoption: Increased adoption by institutional investors, corporations, and even governments could drive long-term demand.
- Supply Scarcity: Bitcoin’s fixed supply of 21 million coins ensures scarcity, supporting future price appreciation.
- Technological Advancements: Upgrades like the Bitcoin Lightning Network and emerging blockchain applications could strengthen its utility and adoption.
Long-Term Price Prediction:
Analysts believe that if Bitcoin can weather the current storm, it could revisit its previous all-time high of $120,000 in the next market cycle. Major financial institutions remain optimistic, with long-term targets ranging from $150,000 to $200,000 by 2025-2026.
3. Macroeconomic Impact: Global Factors at Play
Bitcoin’s future largely depends on macroeconomic factors such as inflation, interest rates, and global economic stability. The recent Federal Reserve policy announcement of a 25-basis-point rate cut dampened investor sentiment, signaling tighter monetary conditions ahead.
Potential Economic Scenarios:
- Positive Case: If inflation moderates and the U.S. Federal Reserve eases its monetary policy, risky assets like Bitcoin could see renewed interest, driving prices higher.
- Negative Case: Continued economic uncertainty, regulatory pressures, and tighter fiscal policies could keep Bitcoin under bearish control.
– Advertisement –

4. Bitcoin Trading Signals and Market Indicators
Investors should monitor these critical Bitcoin trading signals:
- Moving Averages (MAs): Watch for a potential “death cross,” where the 50-day MA falls below the 200-day MA, indicating a long-term downtrend.
- RSI (Relative Strength Index): Bitcoin’s RSI is near 38, close to the oversold zone. A drop below 30 could signal a market bottom, potentially triggering a rebound.
- Trading Volumes: Declining trading volumes suggest reduced buying interest. An increase in volumes on bullish price moves could indicate renewed market optimism.
5. Key Risks to Watch
While Bitcoin has a history of bouncing back from downturns, investors should remain cautious about the following risks:
- Regulatory Actions: Government crackdowns on cryptocurrency trading and exchanges could impact prices negatively.
- Investor Sentiment: Fear-driven market sentiment could exacerbate sell-offs.
- Geopolitical Uncertainty: Global crises, including wars and economic instability, could reduce appetite for high-risk investments like Bitcoin.
Also Read: Bitcoin Crosses $100,000: A Historic Milestone in Cryptocurrency
Conclusion: Will Bitcoin Crash or Recover?
Bitcoin’s future remains uncertain amid current market volatility and bearish technical signals. While the Bitcoin price chart shows a developing bearish pattern, historical market cycles suggest that Bitcoin has always managed to recover from downturns. The critical support level of $98,000 will play a significant role in determining the next move—breaking below this point could trigger further declines toward $95,000 or even $90,000.
However, Bitcoin’s long-term fundamentals remain strong due to its limited supply, institutional adoption, and growing global acceptance. If macroeconomic conditions such as inflation and interest rates improve, the cryptocurrency could regain its momentum and push past key resistance levels like $105,000 or $110,000.
Investors should be cautious, stay updated with crypto market analysis, and monitor key indicators like trading volume, RSI, and moving averages. While the potential for a Bitcoin crash exists in the short term, its long-term outlook remains promising due to its historical resilience and continued global adoption. Preparedness and data-driven strategies will be crucial for navigating the ever-changing cryptocurrency market.
FAQs
Will Bitcoin Crash in 2024?
Bitcoin’s future depends on various market factors, including technical indicators, global economic conditions, and investor sentiment. While current charts show a bearish pattern, historical data suggests that Bitcoin has often rebounded after market downturns.
What Is a Bearish Pattern in Bitcoin’s Price Chart?
A bearish pattern in Bitcoin’s price chart indicates potential downward price movement. Common patterns include head-and-shoulders formations, bearish engulfing candlesticks, and descending triangles, all of which suggest increased selling pressure.
How Can I Predict Bitcoin’s Next Move?
To predict Bitcoin’s next move, follow Bitcoin technical analysis using indicators like the Relative Strength Index (RSI), Moving Averages (MA), and Fibonacci retracement levels. Stay updated with expert market analyses and economic news.
What Are Key Support and Resistance Levels for Bitcoin?
Currently, Bitcoin’s key support level is $98,000. If it breaks below this point, prices may fall toward $95,000 or lower. The resistance level stands at $105,000; a breakout above this could trigger a bullish reversal.
Is Bitcoin Still a Good Investment Despite Market Volatility?
Despite its volatility, Bitcoin remains a popular investment due to its limited supply, global acceptance, and long-term growth potential. Investors should adopt a diversified portfolio and consider risk management strategies when investing in cryptocurrencies.